Value averaging
As I mentioned in the meeting, I will introduce you an investment strategy: value averaging. I learned about this strategy about two years ago. Recently, I did some back testing with Python Programming. The results seem to prove the superiority of this strategy. So I am excited to share it with you.
This link well compares Dollar Cost Averaging vs. Value Averaging.
I backtested these two strategies with S&P 500 index from 1950-2013 (dividends are not considered, inflation ignored, will not affect interpretation anyway). I tested 20-year investment period, starting every 3 years. So there’re 15 such 20-year scenarios (started from 1951, 1954, … 1993).
Dollar cost averaging
Simple to use. You buy $1, 000 worth of SP500 every quarter. Invest $80, 000 over 20 years, your results: mean: $191, 000, stdev: $85, 600
Value averaging back testing
More sophisticated. I won’t go into the details here. What I discovered is, the quarterly growth rate you set strongly affects the way your portfolio grow. And setting a lower/ even negative rate actually gives you better relative return over Dollar Cost Averaging.
For example, if we set quarterly rate at -1.95% (note: minus), our target number should be 1000, 1000(1-0.0195)+1000, …. With this rate, we expect to invest nothing (~$64) at the end of 20 years, and get an average return of $41, 800 ( stdev: $19, 800).
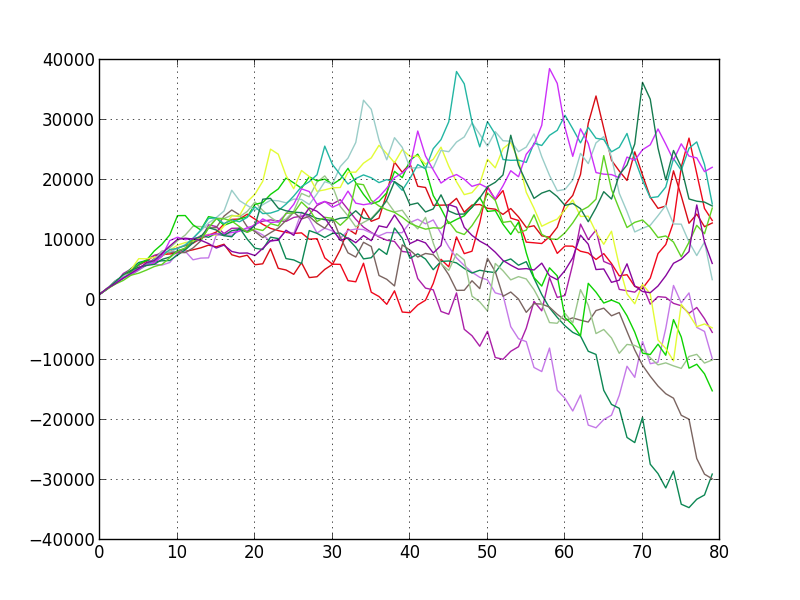
These two figures tell better:
All 15 scenarios: total money invested over time:

All 15 scenarios: total profit earned over time:

The take home message is: if you want to start investing in stock markets, a safe way (and rewarding) is to start an automatic dollar cost averaging account in your Roth IRA. Make sure it’s the money you can set aside for a REALLY long time. Buy total market ETF (ticker: VTI, SPY) every quarter, and stick to the plan no matter how good or bad market is. If you are more curious, you can do some Google research on value averaging, see if you like the idea.
