BioEquity provides a tracking history of price multiple valuation for Big market (S&P 500), Healthcare sector (XLV) and Biotechnology industry (IBB). It tells how the sector and industry are relatively valuated comparing to history and big market.
Update weekly on Monday morning 6:25 AM Eastern Time.
Price to Sales Ratio PS
A valuation ratio of the price paid for a share relative to sales per share for the last 4 quarters. Price To Sales Ratio number indicates the amount of dollars paid on the stock market for one dollar of Sales.
Price To Sales Ratio Formula = (Share Price / Revenues(TTM) per Share)
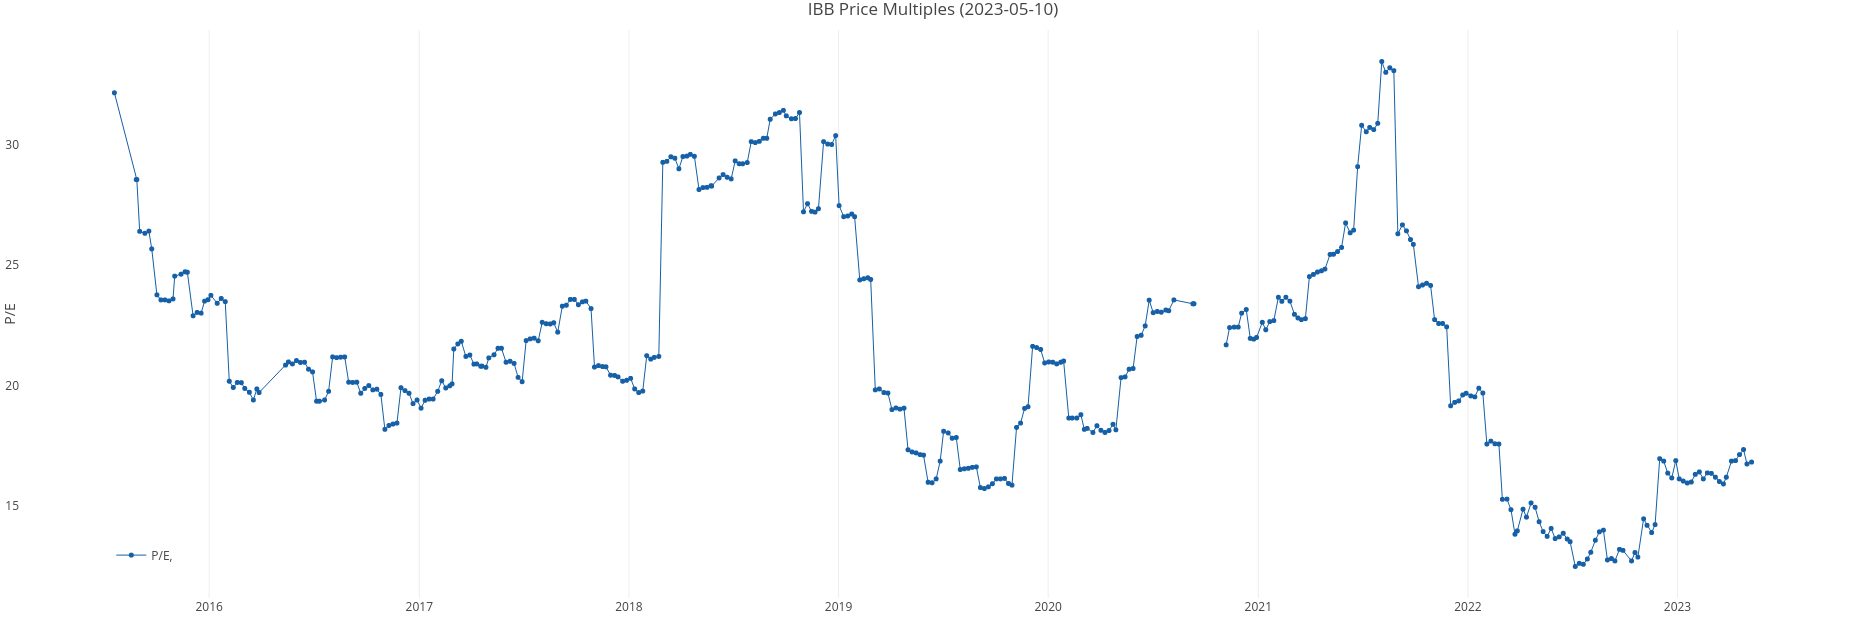
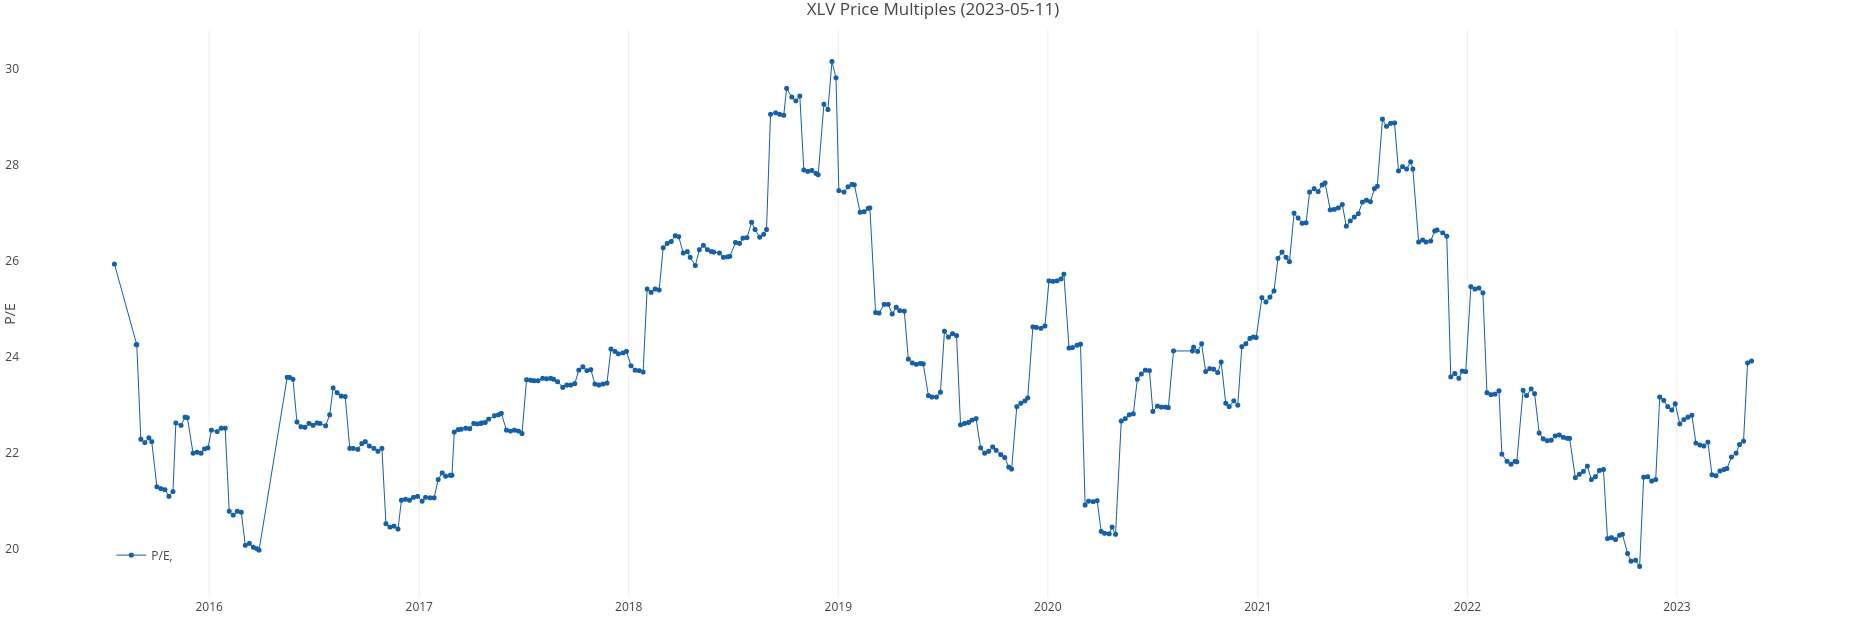
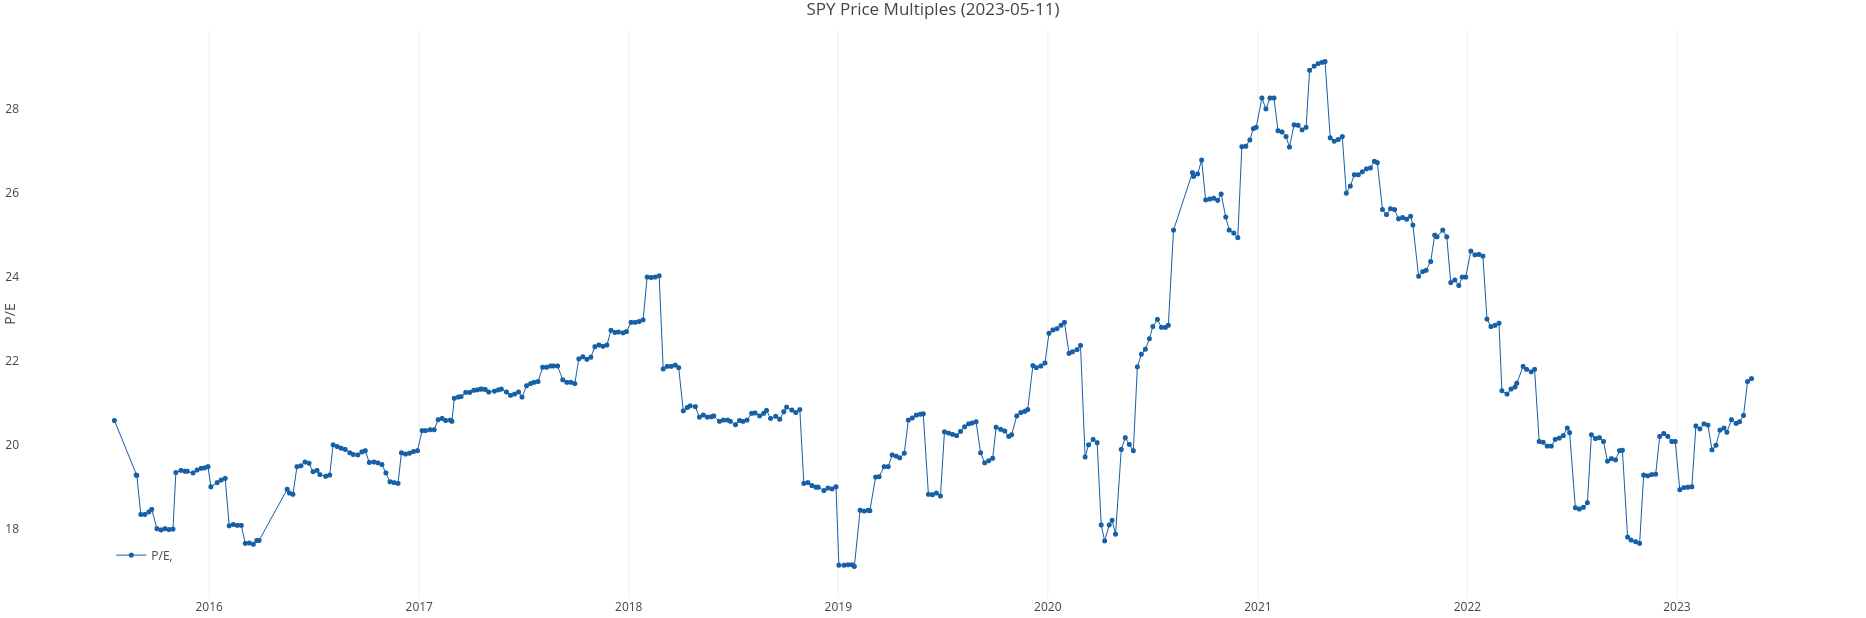
Price to Earnings Ratio PE
The P/E ratio is the most widely used ratio in the valuation of stocks. A valuation ratio of the price paid for a share relative to earnings per share for the last 4 quarters. Price To Earnings number indicates the number of years of identical earnings to pay back purchase price of Stock.
Price To Earnings Formula = (Share Price / Eps(TTM))
Biotechnology (IBB) Price Multiples History Chart
Healthcare (XLV) Price Multiples History Chart
S&P500 (SPY) Price Multiples History Chart
Log
2016.09.07 (CNBC) The health care sector has only lagged this badly twice

Other useful resources
GuruFocus provides Sector Shiller P/E ratios.