Update 08/28/2016: It seems the bear / correction ended in February 2016. Here is a good technical analysis by Blair Jensen at Investing.com.
Update 08/24/2015: Don't be greedy. Trade to your plan. Market panicked the following Monday, with $VIX shot above 50. Theoretically, I could have sold SH today and buy VTI... Only theoretically, it will be too predictive and nerve wracking. Don't be greedy, just watch the show.
Update 08/22/2015: My judgement was right. All indices broke down heavily below 200MA. I sold my SH position according to my preset trading target $SPY 1990. Tempted to change but successfully resisted. Potential improvement: perhaps I bought my SH position at a $VIX high moment. Maybe safer to buy at low $VIX. No regret for VTI selling.
Bull market too long
Bull market is 6+ years old, 3.7 years old if you consider 2011 mini bear. History: 3.7±1.5 years
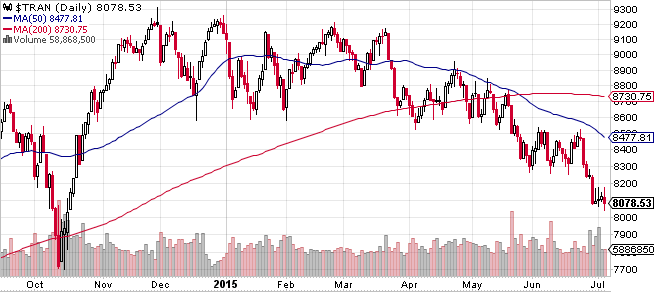
NASDAQ has reached a key level: 2000 tech bubble high. Dow and S&P 500 has long extended to record high, 40% above 2007 high. SP500 has tripled from 2009 low. Nasdaq and SP500 diverged. $TRAN big diverge:
Two CNBC articles on this DOW divergence right on the top:
CNBC-DOW-divergence-05-18-2015
CNBC-on-DOW-divergence-05-21-2015
Index churning and chart
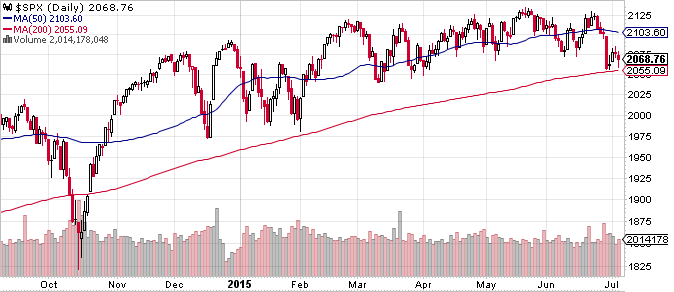
Head and shoulders pattern forming in major indices.
Shiller PE
Shiller PE is above 26. History average: 16±6

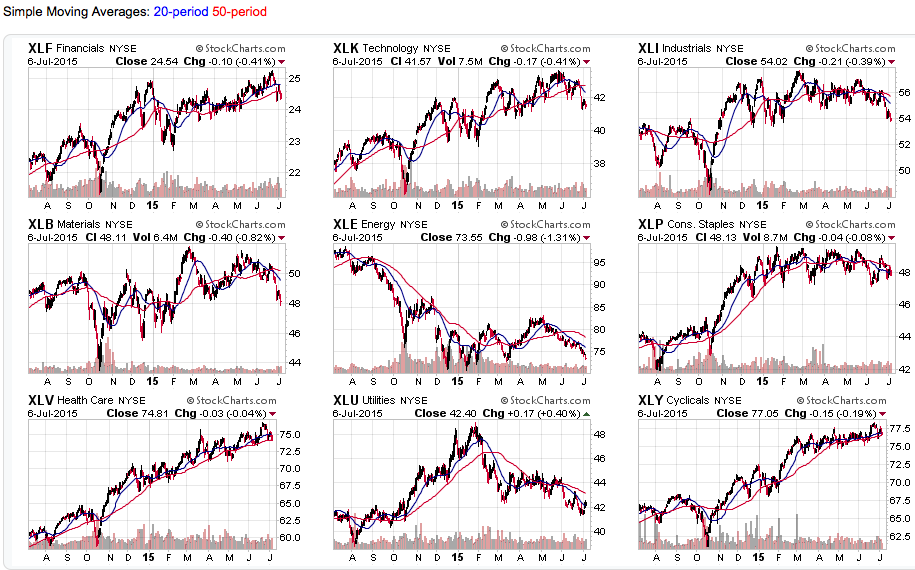
Sectors Diverging
Many sectors dove below 200MA, with only Financial, Healthcare and Consumer Cyclicals are making new high. Not even technology.
Greece and Rate Hike
These news signals a storm coming. Greece debt problem is just the beginning. More trouble is coming in Europe. In US, interest rate hike is coming. While in long term it is a good sign, in short term, market is going to take a hit. Chinese market is not a good sign either.
Dear partners,
It's not wise to predict market. But I feel it's good to warn everyone when everything signals a bear is here. My reasons:
- This bull market is 6+ years old since 03.2009 or 3.7 years old if you start from 10.2011. Average bull market is 3.7+/-1.5 years.
-
Majors indices are way over-extended. SP500 has tripled from 2009 low. SP500 and DOW30 are ~40% above 2007 high. NASDAQ just reached its 2000 tech bubble high of 51xx, a key psychological level.
-
Shiller PE is above 26 (27 last month). History average 16+/-6 [Link]
-
SP500 index has formed a classic head and shoulders pattern. It just pulled back to neckline in the last few days. [link]
-
Sectors are diverging: Only healthcare, finance, and consumer cyclical are making new high recently. Most other sectors are in down trend already. [link]
-
News: Greece debt problem is just the beginning. More trouble is coming in Europe. In US, interest rate hike is coming. While in long term it is a good sign, in short term, market is going to take a hit. Chinese market is not a good sign either.
If I am wrong, please have a big laugh at me.
If I am right, have your money ready. Everything will be on sale in the spring of 2016. Let us do some serious bargain shopping then 🙂
Sincerely,
Yi