Stock price gaps are important technical chart patterns: they represent significant resistance and support levels. Moreover, since more than 92% percent of gaps get filled, unfilled gaps may suggest that stock price may decline to fill it eventually. It would be nice if we know at which price levels there are unfilled gaps. However, it's hard to identify small price gaps on typical chart services, such as Yahoo, Google Finance, or stockcharts.com
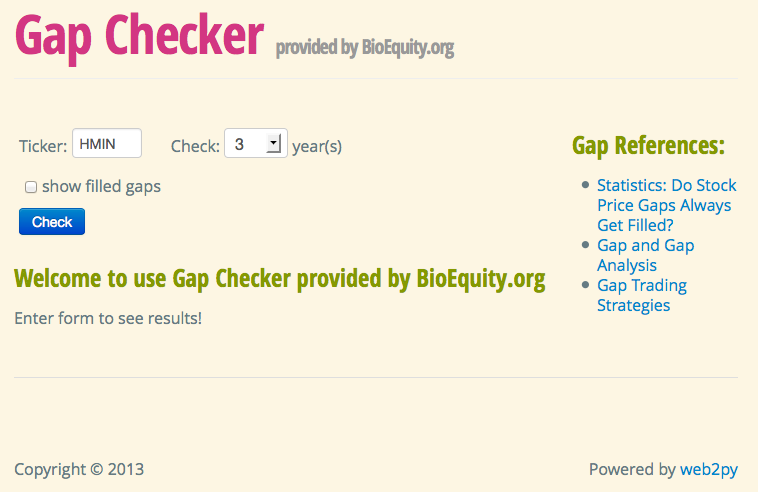
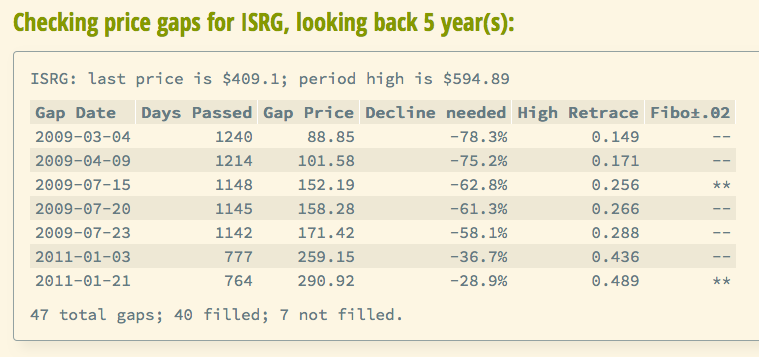
To do this automatically, I have created a Python/Web2Py-based web app: GapDB Gap Checker. With this app, you will be able to search for unfilled gaps in recent 1, 3, 5, or 10 years. The date when gaps are logged, number of days since created (unfilled), and price of gap will be listed. Historical and current stock prices are pulled from Yahoo Finance.


If you are interested in filled gaps, just select the optional checkbox, they will be shown.
I am planning to have introduced Fibonacci retracement to help identify key levels.
Do you have any suggestion for features? Please feel free to contact me!
Book on Gap Trading:
Technical Analysis of Gaps: Identifying Profitable Gaps for Trading @Amazon.com
Instructions
- Historical data are pulled from Yahoo Finance, if your ticker is invalid, please check if Yahoo is using the same ticker and whether its historical data is available from Yahoo.
- If you are sure ticker is right but still have problem. Try again later. Yahoo Finance service can be unavailable at the moment for your ticker.

