"Gaps always get filled."
If you know Technical Analysis (TA) of securities, you probably have heard about the statement. Stock price gap is one of the easiest stock TA patterns by definition (no fancy equations needed). A statement as simple as "gaps always get filled" seems easy to be used as trading strategy.
However, if you are a curious person (like me), you would wonder: what does "always" means, exactly? 100%? A quick Google search shows many people have wondered the same on forums and blogs. Surprisingly, nobody yet gave an empirical answer. Here, I'd like to share some statistics on how often stock price gaps get filled.
Warning: Does NOT apply to "Down" gaps
Many articles and forum discussions cite my research as if the conclusion applied to both up and down gaps. I want to be loud and clear:
The conclusion here does NOT apply to down gaps.
Methodology:
With Python+pandas, I fetched historical stock price data of 30 Dow Jones Industry (^DJI) components from Yahoo, dated 10/27/1989 - 10/11/2013 (24 years). Since Dow stocks are all sound companies and their prices have overall long term uptrend, most "down" gaps should have got filled. So I only studied "up" gaps. An up gap is logged when "low" of the day is higher than "high" of previous day (day i). Once a gap is logged, I look for how many days it took to "fill" the gap (defined as "low" of day k is lower or equal to "high" of day i), or never got filled (when k reaches the end of time studied). Total, filled, and unfilled gaps are counted for each of 30 ^DJI compoments.
Results:
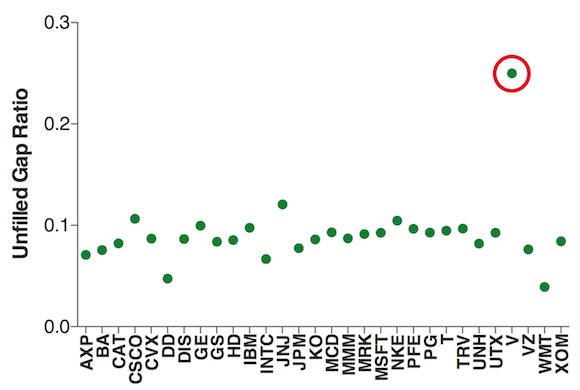
As you can see from the chart above, the unfilled gap ratios of 30 DJI components have very tight distribution.
- Average unfilled gap ratio: 8.8%
- Standard deviation: 3.4%
Apparently, Visa, Inc (NYSE:V) is an outlier in this data set. I think because its relative short history (2008 IPO), many up gaps (especially the ones generated in current bull market) have yet to be filled. When we exclude V, the distribution is even tighter:
- Average unfilled gap ratio: 8.6%
- Standard deviation: 1.6%
Conclusion:
So what's that mean: when a stock price gap is observed, by a chance of 91.4% it will get filled in the future. In layman's word, 9 in 10 gaps get filled; not always, but pretty close.
Survival Bias:
My research focuses on index stocks that have long term up trends. So it means the bankrupted delisted down trend stocks are not considered. For those stocks, up gaps are 100% filled, since the price eventually go to 0.
Nonetheless, you should invest in healthy up trend companies. So this survival bias is not a big issue.
Little things:
- It is possible that some recent (within a year) gaps are not here long enough to get filled. But they count only small portion and should not affect our conclusion significantly.
- On average, there are about 10 up gaps per stock per year.
- If you read this far, I would like to reward you with this little tool. It can check stock price gaps for you automatically:
Gap Checker: find stock price gaps for trading
What do you think? Feel free to share your insights on gaps.
Want to learn more about Technical Analysis? Read these two must-have books:


Supplement: Nasdaq-100
If you are not convinced with "only" 30 stocks in the DJI, I have conducted further analysis with Nasdaq-100 (^NDX) index. Data range (10-27-1989 -> 11-13-2013). I also tried to exclude or include gaps formed in last year. Here, I only shared the data with last year gaps excluded, which I found better.
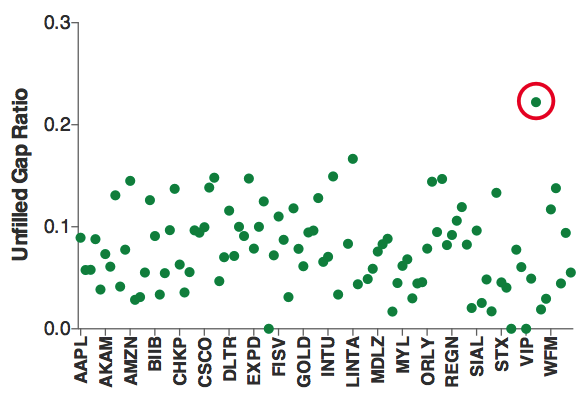

Nasdaq-100 stocks, high volatility by nature, have wider distribution than DJI stocks. A few stocks in the index are not old enough to have many gaps. Nonetheless, about 92.2% gaps get filled.